HuBMAP Multiplexed Immunofluorescence (MxIF)
Last Updated 6/15/2020
Overview
This document details MxIF data states, metadata fields, file structure, QA/QC thresholds, and data processing.
Description
MxIF is used to visualize the distribution of multiple protein antigens in an intact tissue sample by labeling them with fluorescently-tagged antibodies. In brief, tagged antibodies are iteratively incubated with a tissue section, visualized with a fluorescence microscope and then stripped.
Definitions
There are a variety of terms used in this document that may not be familiar to all researchers wanting to make use of the HubMap data. The following figures illustrate several of these terms:
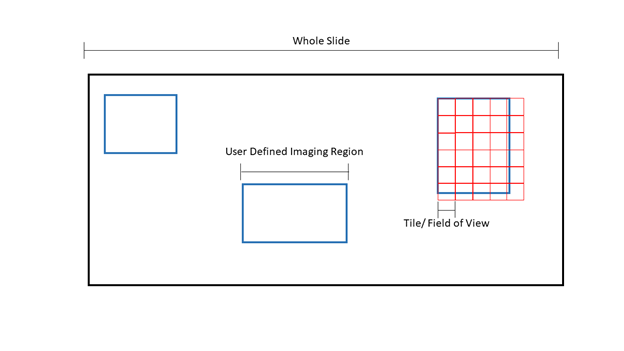
Figure 1: Diagrmatic representation of microscopy terms. The black box is an example slide or cover slip where the sample is located. Blue boxes are examples of “regions” or user defined imaging areas. For instance, if you want to image a specific structure in the tissue, you would designate a “region” over the structure. Red boxes are examples of “tiles” or the microscope “field of view”. The size of the tile is dependent on the microscope set up and objective. Tiles will fill the region. Because the field of view cannot be changed, tiles will overhang from the region, ensuring the entire region is imaged at the expense of extra tiles being acquired.
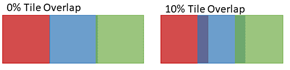 Figure 2: Images are generally acquired with adjacent tiles overlapping, as indicated by the dark regions in the image on the right above. Overlap enhances alignment of tiles for stitching to create a composite image, as shown in Figure 4 below.
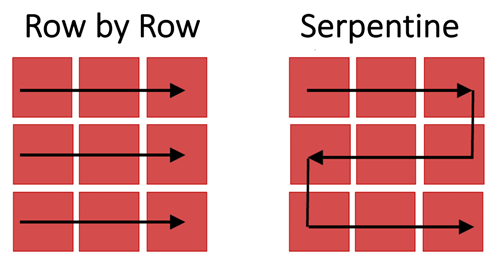 Figure 3: Images of tiles are captured as the stage moves across the imaged region row by row (left) or via a serpentine (or snake-like) path (right).
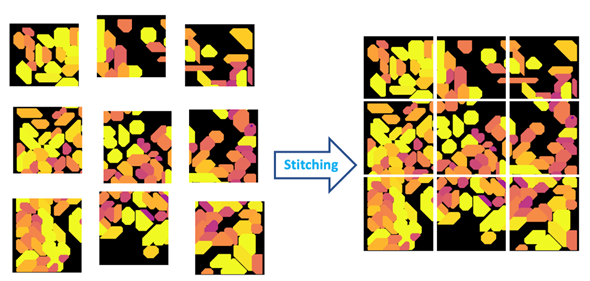 Figure 4: Stitching is the process of aligning and merging neighboring image tiles into a single composite image.
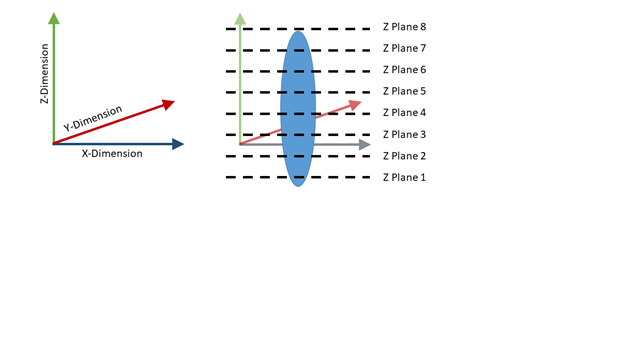 Figure 5: Example defined plane (left) with example imaged z planes (right).
HuBMAP CODEX Data States (Levels)
| Data State | Description | Example File Type |
|---|---|---|
| 0 | Raw image data: This is the data that comes directly off the microscope without preprocessing; sometimes referred to as tiled or unstitched data. (may not always be included). | CZI, TIFF |
| 1 | Processed Microscopy data: Can include stitching, thresholding, background subtraction, z-stack alignment, deconvolution | CZI, TIFF, OME-TIFF |
| 2 | Segmentation: Computationally predicted cell (nucleus, cytoplasm) and/or structural boundaries (tubules, ventricles, etc.) | CSV, TIFF |
| 3 | Annotation (Cells and Structures): Interpretation of microscopy image and/or segmentation in terms of biology (e.g. unhealthy vs healthy, cell-type, function, functional region). | TIFF, PNG |
HuBMAP Metadata
This metadata.tsv schema is now available in Github for download. Any further edits can be made through consultation with the HuBMAP team who will request changes through Github.
Associated Metadata Files
| Metadata File Name | File Type | Field | Definition |
|---|---|---|---|
| OME-TIFF | Format: OME-TIFF | SchemaType | Metadata schema type |
| SchemaVersionMajor | Metadata schema version - major | ||
| SchemaVersionMinor | Metadata schema version - minor | ||
| Name | Name of the microscopy image | ||
| AcquisitionDate | Date and Time of Acquisition | ||
| PhysicalSizeX | Spatial Resolution in x dimension (Pixel Size) | ||
| PhysicalSizeY | Spatial Resolution in y dimension (Pixel Size) | ||
| SizeX | Number of Pixels | ||
| SizeY | Number of Pixels | ||
| SizeZ | Number of Pixels | ||
| Channel:0:0 | DAPI Channel | ||
| Channel:0:1 | FITC Channel | ||
| Channel:0:2 | TRITC Channel | ||
| Channel:0:3 | Cy5 Channel | ||
| Instrument Metadata | XML | SchemaType | Metadata schema type |
| Device | Microscope used | ||
| TheoreticalTotalMagnification | Objective Magnification | ||
| DAPI ExposureTime | Exposure time for DAPI Channel | ||
| DAPI DyeMaxEmission | DAPI Max Emission | ||
| DAPI DyeMAxExcitation | DAPI Max Excitation | ||
| EGFP ExposureTime | Exposure time for EGFP Channel | ||
| EGFP DyeMaxEmission | EGFP Max Emission | ||
| EGFP DyeMAxExcitation | EGFP Max Excitation | ||
| DsRed ExposureTime | Exposure time for DsRed Channel | ||
| DsRed DyeMaxEmission | DsRed Max Emission | ||
| DsRed DyeMaExcitation | DsRed Max Excitation | ||
| Cy5 ExposureTime | Exposure time for Cy5 Channel | ||
| Cy5 DyeMaxEmission | Cy5 Max Emission | ||
| Cy5 DyeMaxExcitation | Cy5 Max Excitation | ||
| Detector ID | Type of Detector/Camera used | ||
| Intensity | Fluorescence Lamp Intensity | ||
| CCF Spatial Metadata | JSON | alignment_id | Unique identifier given to each instance of the Registration UI running in a user’s web browser |
| alignment_operator_first_name | Person who aligned tissue to CCF-First Name | ||
| alignment_operator_last_name | Person who aligned tissue to CCF - Last Name | ||
| alignment_datetime | Date and time tissue was aligned to CCF | ||
| reference_organ_id | Identifier for the reference organ the sample is registered to | ||
| tissue_position_mass_point_x | x position of the center of mass of the tissue sample in relation to the 3-D grid wrapped around the reference organ | ||
| tissue_position_mass_point_y | y position of the center of mass of the tissue sample in relation to the 3-D grid wrapped around the reference organ | ||
| tissue_position_mass_point_z | z position of the center of mass of the tissue sample in relation to the 3-D grid wrapped around the reference organ | ||
| tissue_object_rotation_x | Rotation of the tissue sample around the x-axis of its mass point | ||
| tissue_object_rotation_y | Rotation of the tissue sample around the y-axis of its mass point | ||
| tissue_object_rotation_z | Rotation of the tissue sample around the z-axis of its mass point | ||
| tissue_object_size_x | Size of the x-dimension of the tissue sample | ||
| tissue_object_size_y | Size of the y-dimension of the tissue sample | ||
| tissue_object_size_z | Size of the z-dimension of the tissue sample | ||
| section_number | Tissue Section number. Each section is 10µm thick. | ||
| Antibody Metadata | txt | Cycle_1_Antibody_1 | Name of Antigen Labeled in Blue Channel for MxIF Cycle 1 |
| Cycle_1_Antibody_2 | Name of Antigen Labeled in Green Channel for MxIF Cycle 1 | ||
| Cycle_1_Antibody_3 | Name of Antigen Labeled in Red Channel for MxIF Cycle 1 | ||
| Cycle_1_Antibody_4 | Name of Antigen Labeled in Magenta Channel for MxIF Cycle 1 | ||
| Cycle_1_Cell_Type1 | Cell Type or Structure Labeled by Antibody or Stain in Blue Channel for MxIF Cycle 1 | ||
| Cycle_1_Cell_Type2 | Cell Type or Structure Labeled by Antibody or Stain in Green Channel for MxIF Cycle 1 | ||
| Cycle_1_Cell_Type3 | Cell Type or Structure Labeled by Antibody or Stain in Red Channel for MxIF Cycle 1 | ||
| Cycle_1_Cell_Type4 | Cell Type or Structure Labeled by Antibody or Stain in Magenta Channel for MxIF Cycle 1 | ||
| Cycle_1_Antibody_1_Lot | Lot of Antibody used for Blue Channel for MxIF Cycle 1 | ||
| Cycle_1_Antibody_2_Lot | Lot of Antibody used for Green Channel for MxIF Cycle 1 | ||
| Cycle_1_Antibody_3_Lot | Lot of Antibody used for Red Channel for MxIF Cycle 1 | ||
| Cycle_1_Antibody_4_Lot | Lot of Antibody used for Magenta Channel for MxIF Cycle 1 | ||
| Cycle_2_Antibody_1 | Name of Antigen Labeled in Blue Channel for MxIF Cycle 2 | ||
| Cycle_2_Antibody_2 | Name of Antigen Labeled in Green Channel for MxIF Cycle 2 | ||
| Cycle_2_Antibody_3 | Name of Antigen Labeled in Red Channel for MxIF Cycle 2 | ||
| Cycle_2_Antibody_4 | Name of Antigen Labeled in Magenta Channel for MxIF Cycle 2 | ||
| Cycle_2_Cell_Type1 | Cell Type or Structure Labeled by Antibody or Stain in Blue Channel for MxIF Cycle 1 | ||
| Cycle_2_Cell_Type2 | Cell Type or Structure Labeled by Antibody or Stain in Green Channel for MxIF Cycle 1 | ||
| Cycle_2_Cell_Type3 | Cell Type or Structure Labeled by Antibody or Stain in Red Channel for MxIF Cycle 1 | ||
| Cycle_2_Cell_Type4 | Cell Type or Structure Labeled by Antibody or Stain in Magenta Channel for MxIF Cycle 1 | ||
| Cycle_2_Antibody_1_Lot | Cell Lot of Antibody used for Blue Channel for MxIF Cycle 1 | ||
| Cycle_2_Antibody_2_Lot | Cell Lot of Antibody used for Green Channel for MxIF Cycle 1 | ||
| Cycle_2_Antibody_3_Lot | Cell Lot of Antibody used for Red Channel for MxIF Cycle 1 | ||
| Cycle_2_Antibody_4_Lot | Cell Lot of Antibody used for Magenta Channel for MxIF Cycle 1 | ||
| Cycle_3_Antibody_1 | Name of Antigen Labeled in Blue Channel for MxIF Cycle 1 | ||
| Cycle_3_Antibody_2 | Name of Antigen Labeled in Green Channel for MxIF Cycle 1 | ||
| Cycle_3_Antibody_3 | Name of Antigen Labeled in Red Channel for MxIF Cycle 1 | ||
| Cycle_3_Antibody_4 | Name of Antigen Labeled in Magenta Channel for MxIF Cycle 1 | ||
| Cycle_3_Cell_Type1 | Cell Type or Structure Labeled by Antibody or Stain in Blue Channel for MxIF Cycle 1 | ||
| Cycle_3_Cell_Type2 | Cell Type or Structure Labeled by Antibody or Stain in Green Channel for MxIF Cycle 1 | ||
| Cycle_3_Cell_Type3 | Cell Type or Structure Labeled by Antibody or Stain in Red Channel for MxIF Cycle 1 | ||
| Cycle_3_Cell_Type4 | Cell Type or Structure Labeled by Antibody or Stain in Magenta Channel for MxIF Cycle 1 | ||
| Cycle_3_Antibody_1_Lot | Lot of Antibody used for Blue Channel for MxIF Cycle 1 | ||
| Cycle_3_Antibody_2_Lot | Lot of Antibody used for Green Channel for MxIF Cycle 1 | ||
| Cycle_3_Antibody_3_Lot | Lot of Antibody used for Red Channel for MxIF Cycle 1 | ||
| Cycle_3_Antibody_4_Lot | Lot of Antibody used for Magenta Channel for MxIF Cycle 1 | ||
| Cycle_4_Antibody_1 | Name of Antigen Labeled in Blue Channel for MxIF Cycle 1 | ||
| Cycle_4_Antibody_2 | Name of Antigen Labeled in Green Channel for MxIF Cycle 1 | ||
| Cycle_4_Antibody_3 | Name of Antigen Labeled in Red Channel for MxIF Cycle 1 | ||
| Cycle_4_Antibody_4 | Name of Antigen Labeled in Magenta Channel for MxIF Cycle 1 | ||
| Cycle_4_Cell_Type1 | Cell Type or Structure Labeled by Antibody or Stain in Blue Channel for MxIF Cycle 1 | ||
| Cycle_4_Cell_Type2 | Cell Type or Structure Labeled by Antibody or Stain in Green Channel for MxIF Cycle 1 | ||
| Cycle_4_Cell_Type3 | Cell Type or Structure Labeled by Antibody or Stain in Red Channel for MxIF Cycle 1 | ||
| Cycle_4_Cell_Type4 | Cell Type or Structure Labeled by Antibody or Stain in Magenta Channel for MxIF Cycle 1 | ||
| Cycle_4_Antibody_1_Lot | Cell Lot of Antibody used for Blue Channel for MxIF Cycle 1 | ||
| Cycle_4_Antibody_2_Lot | Cell Lot of Antibody used for Green Channel for MxIF Cycle 1 | ||
| Cycle_4_Antibody_3_Lot | Cell Lot of Antibody used for Red Channel for MxIF Cycle 1 | ||
| Cycle_4_Antibody_4_Lot | Cell Lot of Antibody used for Magenta Channel for MxIF Cycle 1 |
Terms defined in this document
| Term | Definition |
|---|---|
| Intensity | Detector Counts |
| Signal | Intensity produced by fluorescence, both endogenous and introduced |
| Noise | Intensity not produced by light but electronic fluctuations or electronic background. |
| Stitching | Image stitching is the process of combining multiple images (tiles) with overlapping fields of view to produce a single, large image. |
| Alignment/Registration | Image registration is the process of transforming different images into one coordinate system. Registration of all channels in each cycle is performed. |
| Deconvolution | Deconvolution refers to reversing the optical distortion that takes place in an optical microscope to sharpen images/ improve definition. Practically, deconvolution can also sharpen images that suffer from fast motion or jiggles during capturing. |
| Channels | Name of the fluorescence excitation wavelengths used. May be expressed as a fluorophore name (e.g. DAPI, GFP, DsRED, Cy5), wavelength (e.g. 488, 540, 750), or color (e.g. green, red, blue). |
| Cycles | A process of adding a round of antibodies, imaging the bound antibodies, stripping the antibodies, and washing away the released antibody. |
| Regions | User defined imaging area. |
| Autofluorescence/Background | Endogenous fluorescence signal. |
| Fluorescence | Light produced by a fluorophore that is bound to an antibody tag. |
| Z-stack | A series of images produced at different stage heights or z positions. |
| X plane | Plane that determines width |
| Y plane | Plane that determines height |
| Z plane | Plane that determines depth |
| Pitch | Distance between pixels |
| Tile | Rectangular field-of-view (Figure 1). |
| Pixel | How close two objects can be and still be differentiated within an image. This is generally dependent upon the diffraction limit of light and the microscope objective. |
| Field of View | Angle through which light can reach the detector. Available imaging area without stage movement. |
| Background Subtraction | Subtraction of autofluorescence intensity from total intensity. |
For Additional Help
Please contact: Jeffrey Spraggins