HuBMAP Matrix Assisted Laser Desorption/Ionization (MALDI) Imaging Mass Spectrometry (IMS)
Last updated: 6/12/2020
Overview
This document details MALDI IMS data states, metadata fields, and file structure, QA/QC thresholds, and data processing.
Description
Matrix-assisted laser desorption/ionization (MALDI) imaging mass spectrometry (IMS) combines the sensitivity and molecular specificity of MS with the spatial fidelity of classical microscopy. IMS is routinely used to study a variety of analyte classes including pharmaceuticals, metabolites, lipids, nucleic acids, glycans, peptides and proteins. Briefly, tissue samples are thinly sectioned, mounted onto conductive glass slides, and coated with a light absorbing matrix that facilitates desorption and ionization of endogenous molecules. Ions are generated by laser irradiation at each position (pixel) within a region of interest in the tissue resulting in the generation of a mass/charge (m/z) spectrum for each pixel. The spatial resolution of the image is defined by the size of the laser spot at the sample surface, the spacing between pixels in the array (i.e. pitch), and sample preparation processes. The data generated for HuBMAP by the Vanderbilt TMC utilizes the Bruker SmartBeam 3-D laser system, which can achieve high throughput acquisition rates of up to 20 px/s while maintaining discrete pixels. This is done by incorporating galvo mirrors into the laser path. The additional mirrors allow laser redirection so that a defined number of laser shots can be collected from a single pixel location. Using this beam steering approach, the laser raster can be performed to effectively collect data from a square pixel with an area set by the operator. An image is then synthesized by plotting the m/z signal intensities for the entire array of pixel coordinates.
Definitions
There are a variety of terms used in this document that may not be familiar to all researchers wanting to make use of the HubMap data. The following figures illustrate several of these terms:
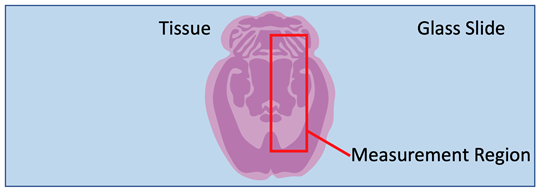
Figure 1: Pictorial representation of imaging mass spectrometry terms. The blue box is an example slide or cover slip where the sample is located. The red box is an examples of “regions” or user defined imaging areas on tissue. For instance, if you want to image a specific structure in the tissue, you would designate a “region” over the structure.
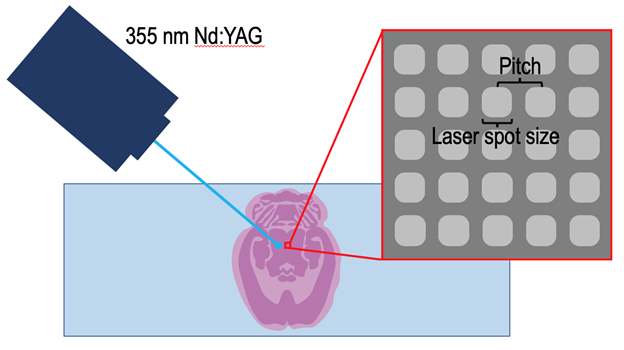
Figure 2: MALDI IMS is performed by rastering a sample under a laser so that ions generated from a defined number of laser shots are collected from each pixel in the user defined measurement region. The spatial resolution is determined by the laser spot size at the surface and the pitch between the individual pixels.
HuBMAP Data States (Levels)
| Data State | Description | Example File Type |
|---|---|---|
| 0 | Raw image data: This is the data that comes directly off the mass spectrometer without preprocessing; sometimes referred to as raw spectral data. | imzML |
| 1 | Processed imaging MS data: Can include peak alignment, intensity normalization, m/z recalibration | CSV, OME-TIFF |
HuBMAP Metadata
The Github link to the metadata.tsv, where you’ll find fields, descriptions & required formats.
Associated JSON Files
All HuBMAP IMS data includes a metadata JASON file with additional instrumental parameters.
HuBMAP MALDI-IMS File Structure
enter code here
Data Folder
/VAN000*-*K-**-**_**
/CCF Metadata
	VAN000*-*K-**-**_ccf_metadata
/ VAN000*-*K-**-**_**-IMS
	/VAN000*-*K-**-**_**-IMS_NegMode
		/csv
			VAN000*-*K-**-**_**-IMS_NegMode_columnar.csv
		/imzML
			/ VAN000*-*K-**-**_**-IMS_NegMode.ibd
			/ VAN000*-*K-**-**_**-IMS_NegMode.imzML/metadata
/ VAN000*-*K-**-**_**-IMS_NegMode_meta.json
/ VAN000*-*K-**-**_**-IMS_NegMode_tform_to_microscopy.txt
/ VAN000*-*K-**-**_**-IMS_NegMode_LipidAssignments.xlsx/ometiffs
/ VAN000*-*K-**-**_**-IMS_NegMode_multilayer.ome.tiff
/separate
	…..Individual ome.tiff files for each ion.
	/VAN000*-*K-**-**_**-IMS_PosMode
		/csv
			VAN000*-*K-**-**_**
			-IMS_PosMode_columnar.csv
		/imzML
			/ VAN000*-*K-**-**_**-IMS_PosMode.ibd
			/ VAN000*-*K-**-**_**-IMS_PosMode.imzML/metadata
/ VAN000*-*K-**-**_**-IMS_PosMode_meta.json
/ VAN000*-*K-**-**_**-IMS_PosMode_tform_to_microscopy.txt
/ VAN000*-*K-**-**_**-IMS_PosMode_LipidAssignments.xlsx
/ometiffs
/ VAN000*-*K-**-**_**IMS_PosMode_multilayer.ome.tiff
/separate
	…..Individual ome.tiff files for each ion.
HuBMAP QC/QA for Level 1 MALDI IMS Data
To monitor MALDI and mass analyzer performance, laser spot size and signal intensity are monitored regularly prior to all experiments. Sensitivity checks and mass calibration were performed prior to each image by collecting ESI spectra from ESI-L tune mix (Agilent). MALDI spot size and MALDI sensitivity are then performed on the sample slide by evaluating signal intensity in a ‘test region’ of the tissue, away from where images will be collected. Lipid signal (e.g. m/z 885 in negative ion mode) and overall intensity is monitored at sequential test pixels collected with the desired spot size and pitch. Number of laser shots and laser energy are adjusted to optimize signal and spatial resolution.
Terms defined in this document
| IMS Tags | Description |
|---|---|
| neg | negative ionization mode |
| pos | positive ionization mode |
| imzML | imzML file format |
| csv | columnar data format |
| multilayer | ome.tiff file where sublayers are different ion images |
| individual_ii | ome.tiff folder where each ion is saved as a separate ome.tifft |
| tform_to_microscopy.txt | affine transformation of the output ome.tiff files to microscopy |
| tform_to_microscopy.txt | essentially overlay is achieved by upscaling the images by 20 in x and y |
For Additional Help
Please contact: Jeffrey Spraggins