HuBMAP Light Sheet Fluorescence Microscopy (UF-TMC)
Last Updated: 1/26/2021
Overview:
This document details light sheet fluorescence microscopy (LSFM) data states, metadata fields, file structure, QA/QC thresholds, and data processing.
Description:
Light sheet fluorescence microscopy is used to image large volumes of tissue following clearing and multiplexed immunolabeling protocols. Datasets consist of one or more Z-stacks, series of optical sections along the z axis. Corresponding Z-stack planes can be stitched together for a Multiview dataset.
Defintions:
Terms used in this document:
| Term | Definition |
|---|---|
| Fluorescence | Light produced by a fluorophore that is bound to an antibody tag |
| Volume | Three-dimensional region of interest |
| Tile | Field of view in the xy dimension |
| Y axis | Plane that determines height |
| X axis | Plane that determines width |
| Z axis | Plane that determines depth |
| Optical section/plane | A tile at a specific depth in the z-stack |
| Z-stack | A series of images produced at different stage heights or z positions |
| Mutliview | A series of Z-stacks collected in a serpentine path used to acquire large volume datasets. A percentage of tile overlap will occur for both the x- and y-axes. |
| Stitching | Image stitching is the process of combining multiple images (tiles) with overlapping fields of view to produce a single, large image. |
| Tile overlap | Percent of shared region with neighboring tiles in xy dimension |
| Serpentine | Pattern of z-stack acquisition, used for stitching z planes |
| Channels | Name of the fluorescence excitation wavelengths used. May be expressed as a fluorophore name (e.g. DAPI, GFP, DsRED, Cy5), wavelength (e.g. 488, 540, 750), or color (e.g. green, red, blue). |
Grey Box - Whole volume of tissue following clearing protocol.
Multicolor boxes - Nine Z-stacks encompassing the user defined volume of interest; numbered in order of acquisition. This multi-Z-stack dataset is called a Multiview.
Box 3 - Example of Z-stack with 10 optical planes (red dashed squares). Distance between optical planes is “IncrementZ”.
Green dashed arrows - Serpentine acquisition sequence of Z-stacks for a Multiview data set.
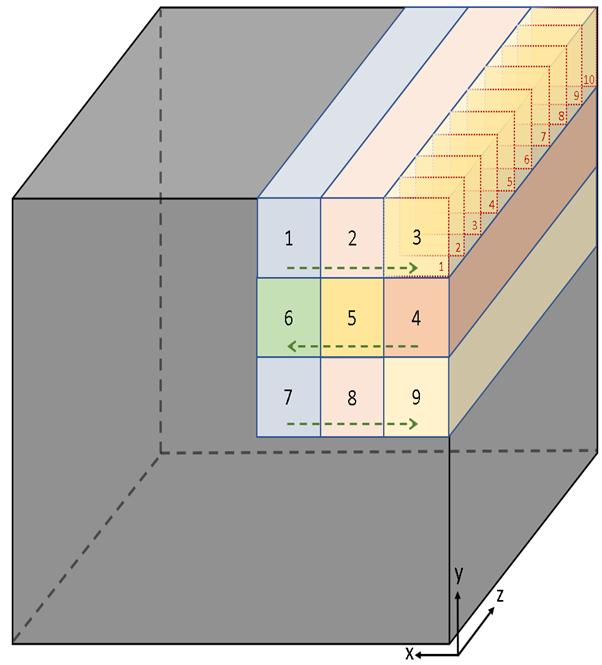 Figure 1: The first 10 optical planes imaged are in Box 1, 11-20 in Box 2, 21-30 in Box 3, and so on. The total number of z-stacks acquired (SizeV) is determined by the xy plane field of view which depends on instrument and acquisition settings.
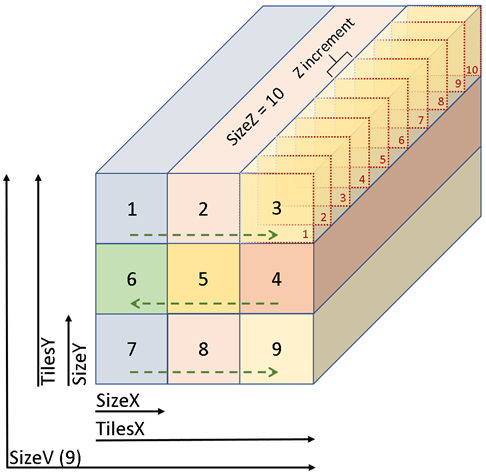
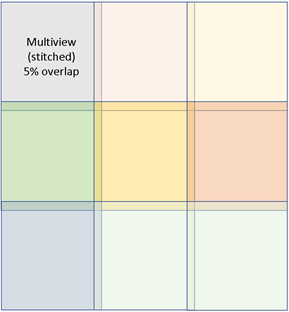
Figure 2: Stitching together neighboring z-stack tiles occurs in post-processing (data state, level 2). Tile stitching occurs within the same Z-plane from boxes 1 thru 9 and is reliant upon overlap in the X- and Y- field of view. Tile stitching is a supervised task and may have minor error in alignments. Automated stitching alignment is not without error either and is increasingly challenging for larger volumes of tissue. Standard overlap of tiles is 5%.
HuBMAP Lightsheet Data States (Levels):
| Data State | Description | Example File Type | |—|—|—| | 0 | Raw image data: This is the data that comes directly off the microscope without preprocessing; sometimes referred to as tiled or unstitched data. (may not always be included).| CZI, OME-TIFF| | 1 | Processed Microscopy data: Can include stitching, thresholding, background subtraction, z-stack alignment, deconvolution. May not always be included. | TIFF, MP4| | 2 | Segmentation: Computationally predicted cell (nucleus, cytoplasm) and/or structural boundaries (tubules, ventricles, etc.) May not always be included. | CSV, TIFF, MP4, STL| | 3 | Annotation (Cells and Structures): Interpretation of microscopy image and/or segmentation in terms of biology (e.g. unhealthy vs healthy, cell-type, function, functional region). May not always be included. | TIFF, MP4|
Metadata:
The following metadata fields reside in a CSV within the parent folder of each dataset. Terms are native to the *.CZI file generated from Zeiss’s Zen acquisition software.
Essential Metadata Overview for Volumetric Reconstruction
| Light sheet microscopy | Defintion | Example |
|---|---|---|
| Application|Version | Software version used | 9.2.8.54 |
| Document|Name | Descriptive name assigned to the data. Example: local name construct indicating scan region (004), magnification (20x), laser line (638), protein stained (UCHL1), and acquisition mode (multiview). | 004_20x_638_UCHL1_Multiview |
| CreationDate | Date of experiment | 2020-12-18T13:20:36 |
| Location | Path of file on local computer | Z:\Currlin_S\HUBMAP\IHC 2[9]\LN\004_20x_638_UCHL1_Multiview.czi |
| Series 0 Name | Name of data series consisting of Z planes acquired with illumination from the left | 004_20x_638_UCHL1_Multiview #1 |
| Series 1 Name | Name of data series consisting of Z planes acquired with illumination from the right | 004_20x_638_UCHL1_Multiview #2 |
| DeviceMode | Illumination strategy. Example: Single plane illumination microscopy | SPIM |
| BitsPerPixel | Bit depth of each channe | 16 |
| Objective|Manufactureer|Model | Brand/specification of the microscope objective lens being used | LSFM clearing 20x/1.0 Corr_4915000033 |
| LensNA | Numerical aperture of the lens | 1 |
| NominalMagnification | Microscope objective lens magnification (e.g. 20x) | C20 |
| Zoom | Digital zoom used during acquisition | 1 |
| SizeC | Number of fluorescent channels imaged | 1 |
| Filter #1 | Laser blocking filter with wavelengths (nm) | LBF 405/488/561/640 |
| Filter #2 | Laser emission filter | SBS LP 580 |
| Attenuator|Laser | Laser wavelength and max power in mW | Laser 638-75 |
| Channel|Wavelength | Excitation wavelength in nanometers (energy of light used for given channel). One value per channel. | 638 |
| TilesX | Number of horizontal tiles across the region collected | 3 |
| Scene|Position|X | Starting position of sample stage in X-dimension | -300.055 |
| SizeX | Number of pixels in the X-dimension | 1920 |
| ScalingX | Size of pixel in X-dimension (reported in meters) | 0.000000229 |
| TilesY | Number of vertical tiles across region collected | 3 |
| Scene|Position|Y | Starting position of sample stage in Y-dimension | 8092.27 |
| SizeY | Number of pixels in the Y-dimension | 1920 |
| ScalingY | Size of pixel in Y-dimension (reported in meters) | 0.000000229 |
| SizeZ | Number of planes in a Z-stack | 10 |
| Scene|Position|Z | Starting position of sample stage in Z-dimension | 2417.6 |
| IncrementZ | Distance between Z planes in microns | 30 |
| SizeV | Number of Multiview Z-stacks. Number of X-direction tiles multiplied by number of Y-direction tiles. | 9 |
| CenterPosition | For multiview acquisitions these are coordinates of the central z-stack. | -304.42467 10324.53600 2249.28626 |
| View|Offset | Overlap in X and Y dimensions of neighboring imaging planes among Z-stacks in a multiview acquisition (microns) | 232.776408 |
| View|PositionX #01 | Stage position in microns (relative to start position) for the X dimension of the first Z-stack in a multiview dataset | 300.055 |
| View|PositionX #02 | Stage position in microns (relative to start position) for the X dimension of the second Z-stack in a multiview dataset | 717.105 |
| View|PositionY #01 | Stage position in microns (relative to start position) for the Y dimension of the first Z-stack in a multiview dataset | 8092.268 |
| View|PositionY #02 | Stage position in microns (relative to start position) for the Y dimension of the second Z-stack in a multiview dataset | 8092.268 |
| View|PositionZ #01 | Stage position in microns (relative to start position) for the Z dimension of the first Z-stack in a multiview dataset | 2417.598 |
| View|PositionZ #02 | Stage position in microns (relative to start position) for the Z dimension of the second Z-stack in a multiview dataset | 2417.598 |
| View|IncrementZ #01 | The distance in microns between imaging planes in a multiview dataset for the first Z-stack | 30 |
| View|IncrementZ #02 | The distance in microns between imaging planes in a multiview dataset for the second Z-stack | 30 |
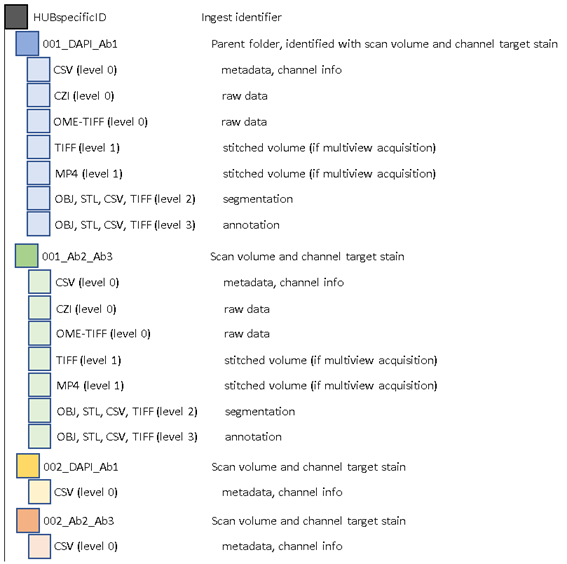
LSFM General File Strcuture:
Antibody metadata will be included in the Parent Folder of corresponding datasets within the metadata and channel info CSV.
![]
LSFM Data Processing by the HIVE
Please see the HIVE LSFM data processing pipeline documentation.
For Additional Help:
Please contact: Seth Curlin