Image Mass Cytometry (IMC)
Last Updated 6/22/2020
Overview
This document describes Imaging Mass Cytometry technology, generated data files & data levels, file structure, metadata fields, QA/QC thresholds, and HIVE data processing.
Description
Imaging Mass Cytometry combines standard immunohistochemistry with CyTOF mass cytometry to resolve the cellular localization of up to 40 proteins in a tissue sample. Multiplexing of dozens of proteins is possible because the antibodies are tagged with rare-earth metal isotopes of defined atomic mass rather than fluorophores which are subject to spectral signal overlap. High-resolution laser ablation of tissue stained with these antibody-metal conjugates generates clouds of tissue particles which are atomized, ionized, and detected in a time-of-flight mass cytometer. Signals are then plotted against the coordinates of each single laser shot to synthesize one image per mass channel, with high-dimensional images produced by overlaying images from multiple channels.
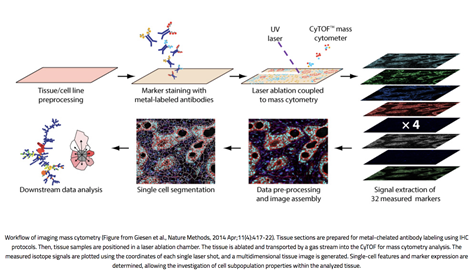
Figure 1. Workflow of imaging mass cytometry (From Giesen et al., 2014).
Definitions
The following is a table of terms relevant to understanding IMC data:
| Term | Definition |
|---|---|
| IMC | Imaging Mass Cytometry |
| Conjugated Antibody | An antibody covalently coupled to a metal isotope via a polymer. |
| Pulse | Analog value converted from voltage generated by a particle striking the detector. |
| Pulse Count | The number of pulses induced by ions arriving at the detector. |
| Intensity | Integral of overlapping ion-induced pulses. |
| (Dual) counts | The measured counts in IMC are dual counts (Counts = Intensity * Dual Count Coefficient). |
| (Mass) channel | Name of the metal isotope detected (e.g. 113In, 149Sm). |
| Target | Name of the epitope targeted by the antibody conjugated to the detected metal isotope (e.g. Histone H3, CD20). |
| ROI | Region of Interest - User defined imaging area. |
| Pixel | Each pixel in an IMC image corresponds to a single laser shot and is the smallest component of that image. |
HuBMAP IMC Data States (Levels)
| Data Levels | Description | Example File Type |
|---|---|---|
| 0 | Raw image data: Image stacks for each region of interest containing all channel images. | OME, TIFF |
| 1 | Segmented data: Single cell data extracted after segmentation. | CSV, TIFF |
| 2 | Annotated data (Cells and Structures): Interpretation of marker expression profiles enabled the assignment of cell types to clusters. | PNG, PDF |
HuBMAP Metadata:
All HuBMAP IMC data will have searchable metadata fields. The metadata.tsv is available for download from Github where the descriptions and required field input formats can be found
In addition, all HuBMAP IMC data will have an associated “acquisition_metadata.csv” file containing the following additional metadata fields:
| “AblationPower” | Relative ablation power (arbitrary units). |
|---|---|
| “AfterAblationImageEndOffset” | The number of bytes from the beginning of the MCD file where the respective entity is stored as binary. |
| “AfterAblationImageStartOffset” | The number of bytes from the beginning of the MCD file where the respective entity is stored as binary. |
| “BeforeAblationImageEndOffset” | The number of bytes from the beginning of the MCD file where the respective entity is stored as binary. |
| “BeforeAblationImageStartOffset” | The number of bytes from the beginning of the MCD file where the respective entity is stored as binary. |
| “DataEndOffset” | The number of bytes from the beginning of the MCD file where the respective entity is stored as binary. |
| “DataStartOffset” | The number of bytes from the beginning of the MCD file where the respective entity is stored as binary. |
| “Description” | A description of the region of interest. |
| “MovementType” | Pattern of laser ablation over the tissue surface. |
| “ROIEndXPosUm” | End X-coordinates of the region of interest (µm). |
| “ROIEndYPosUm” | End Y-coordinates of the region of interest (µm) |
| “ROIStartXPosUm” | Start X-coordinates of the region of interest (µm). Note: This value must be divided by 1000 to correct for a bug (missing decimal point) in the Fluidigm software. |
| “ROIStartYPosUm” | Start Y-coordinates of the region of interest (µm). Note: This value must be divided by 1000 to correct for a bug (missing decimal point) in the Fluidigm software. |
| “Template” | Name of imported csv equivalent file specifying the antibody panel used for tissue staining. |
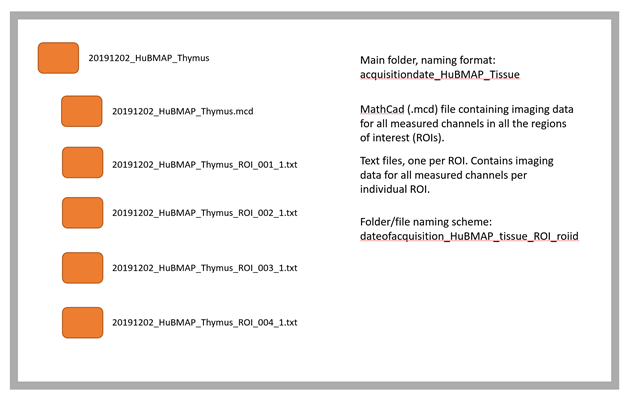
HuBMAP IMC Raw File Structure
- HuBMAP IMC Raw File Structure
A schematic of the general structure of the stage 0 (raw) data produced by the fluidigm software is shown below:
 2) HuBMAP IMC Processed Data File Description
| Processed Data Loaded | Descriptor (the name should contain the following) | Example |
|---|---|---|
| QA/QC Pass/Fail Channel Report | channelnames_report.csv |
/University of Florida TMC/256795b18af5b1d318e2326266053f7e/ |
| CSV file containing all single cell measurements | 20191128_hubMAP__masterfile |
/U/University of Florida TMC/256795b18af5b1d318e2326266053f7e/SingleCellData/ |
| Classified cell types projected onto images for each measured region of each tissue type | ClusterDisplay_* |
/University of Florida TMC/256795b18af5b1d318e2326266053f7e/Mapping/ |
| Plots of data: tSNE, heatmap of marker expression per cluster and density plots of marker intensity | 20191128_HubMAP__PhenoGraph_tsne_M.png 20191128_HubMAP__heatmap.pdf 20191128_HubMAP__histogram_sample.png |
/University of Florida TMC/256795b18af5b1d318e2326266053f7e/processed/ |
HuBMAP QA/QC of raw (state0) data files
- Raw data (level 0) QC
- Basic image quality control by visual inspection of images. Software used: MCD Viewer (fluidigm),histoCAT++, version 2.2 (http://www.bodenmillerlab.com/research-2/histocal-2/) or FIJI, v1.53a.
- Each antibody was assigned a pass/fail score per tissue type, which can be found in the channelnames_report.csv file. Pass/fail is determined by visual inspection of the images generated, Staining must be present in at least one ROI, distinguishable form background and produce the expected pattern for the target tissue type.
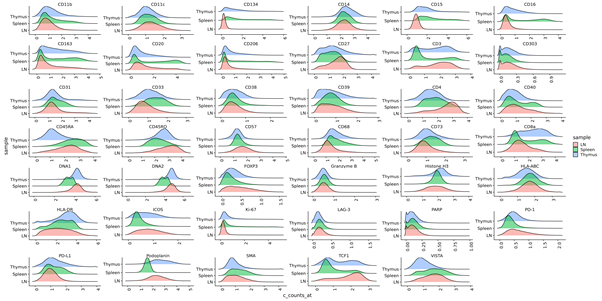
- Segmented cell data (level 1) QC - Create density plots showing intensity profiles for each marker for all regions of interest, shown below.
- Annotated cell data (level 2) QC - After clustering, clusters were assigned to cell types based on marker expression. In order to ensure correct cell type assignment, the custom package cytomapper (https://github.com/BodenmillerGroup/cytomapper) was used to overlay cell masks onto raw IMC images and visualise the expression of different markers. This allowed us to visually verify that a particular cell cluster was in fact the correct cell type, based on coexpression of other informative markers.
IMC Data Processing by the Bodenmiller IMC Lab
-
Data preprocessing performed according to the Bodenmiller IMC Segmentation Pipeline (https://github.com/BodenmillerGroup/ImcSegmentationPipeline). The major steps are described below.
-
Generate *ome.tiff image stacks (https://github.com/BodenmillerGroup/imctools).
-
Create *.tiff image stacks with relevant channels required for cell segmentation (https://github.com/BodenmillerGroup/imctools).
-
Use the pixel classification software Ilastik (https://www.ilastik.org/) to generate probability maps (.tiff files) for nucleus, cytoplasm and background compartments.
-
Use these maps to generate cell masks (.tiff files) using CellProfiler (https://cellprofiler.org/).
-
Extract feature measurements per channel for each cell using CellProfiler (.csv file).
-
Single cell information can then be imported into R for downstream analysis, including dimensionality reduction (tSNE, UMAP), clustering (PhenoGraph) and cell type annotation.
For Additional Help
Please contact: Clive Wasserfall & Pierre Bost.