HuBMAP single cell & bulk ATAC Sequence Data
Last Updated: 6/23/2020
Overview
This document details data levels, metadata fields, file structure, QA/QC thresholds, and data processing for bulk and single-cell ATAC sequencing assays.
Description
While bulk ATACseq (Assay for Transposase-Accessible Chromatin) reveals the average of chromatin architecture for cells comprising a tissue sample, single-cell ATACseq (scATACseq), employs per-cell and per-molecule barcoding to enable single-cell resolution of chromatin architecture. The ATACseq assay itself is the same for bulk and single-cell templates. ATAC-seq employs a genetically engineered Tn5 transposase that inserts sequencing adapters into accessible regions of the chromatin surface. Analysis of the sequences derived from the Tn5 sequencing adapters allows identification of those regions of the chromatin located on the cell-state-specific surface of the chromatin. Single cell, single molecule barcoding: This diagram of the DropSeq process (droplet barcoding of single cells) from the laboratory of Steve McCarroll at Harvard Medical School illustrates the general strategy for droplet-based barcoding:
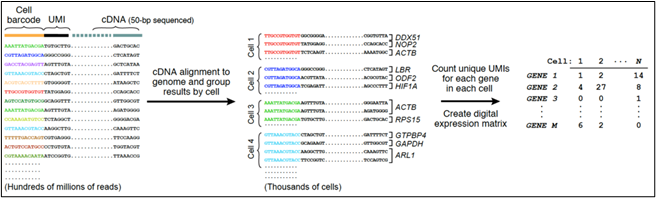 Figure 1: Diagram of the DROPseq process (Macosko et al., 2015).
Software packages such as Seurat are available for single-cell data QC, RNAseq and data exploration.
scATACseq is a single-cell sequencing “Assay for Transposase-Accessible Chromatin” which reveals detailed information about cell-state-specific chromatin architecture.
In contrast to droplet barcoding methods, SPLiT-Seq (split-pool ligation-based transcriptome sequencing) employs a 96-well plate-based barcoding-by-ligation strategy (a.k.a. combinatorial index barcoding). In the case of sciATACseq, well-specific DNA-barcodes are ligated to chromatin-DNA reads (rather than cDNA). Labeled DNA reads are then pooled and split into a new 96-well plate. The barcode ligation, pooling & splitting is repeated in several iterations, as shown in Figure 2 below.
(Note: combinatorial index barcoding assays have the prefix “sci-” rather than “sc”, which generally indicates standard droplet-based barcoding).
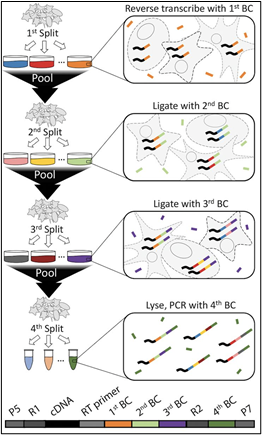
Figure 2: Diagram of the combinatorial index barcoding process (Rosenberg et al., 2018).
Definitions
Some terms in this document may not be familiar to all HubMap users. The following table lists several:
| Term | Definition |
|---|---|
| UMI | Unique molecular identifier (not used for scATAC-seq) |
| BAM | A Binary sequence alignment/map file. Contains the alignments for all reads against a reference genome. An equivalent text version of this file is called a SAM file. |
| Read | A short sequence of DNA generated by a sequencing instrument. |
| Cell barcode | A short DNA sequence common to all molecules sequenced from a single compartment (cell). |
| Fragment | A piece of double-stranded DNA generated from the insertion of two Tn5 sequencing adapters. This is a sequenceable output from the ATAC-seq experiment. |
| Fragment file | A sorted, block-gzip compressed and indexed BED file containing the positions of all sequenced Tn5 insertion sites for all cells. Contains 5 columns: chromosome, insertion 1 position, insertion 2 position, cell barcode, sequence count. |
| Fragment file index | A tabix index for the fragment file. Allows reading subsets of the file by position. |
| TSS | The transcriptional start site of an annotated gene. |
| Blacklist region | Region of the genome that accumulates artefactual read enrichment |
| SAM | Sequence Alignment Map File: A text file that describes the output of a program that aligns sequence reads with a reference genome. An equivalent binary version of this file is called a BAM file |
| Phred Score | An instrument-generated quality measure for each base. |
| SNARE-ATACseq | Single-cell sequencing “Assay for Transposase-Accessible Chromatin” |
| sciATACseq | Single-cell sequencing with combinatorial indexing “Assay for Transposase-Accessible Chromatin” |
| snATACseq | Single nucleus sequencing “Assay for Transposase-Accessible Chromatin” |
| Bulk ATACseq | |
| library_pcr_cycles_for_sample_index | This step adds the Sample Index N barcode shown below in Figure 3. This reference is from ChromiumNext GEM ATAC sequencing. |
HuBMAP ATAC Sequence Data States (Levels)
The HuBMAP project provides data to the public in a variety of data states. A data state describes the amount of processing that has been done to the data. The term “data states” is similar in connotation to the term “data levels” which is used by the genomics community. However a data state will not necessarily imply linear processing of the data. The data states for ATAC seq data provided by the HuBMAP project are listed below:
| Data State | Description | Example File Type |
|---|---|---|
| 0 | Raw data: This is the raw sequence data (unprocessed) generated directly by the sequence instrument in files either with Phred quality scores (fastq) | FASTQ |
| 1 | Aligned data: SAM files contain sequence data that has been aligned to a reference genome and includes chromosome coordinates. BAM files are compressed binary versions of SAM files | SAM, BAM |
| 2 | Fragment file: For sc/sciATACseq, this is a compressed file containing the position of each Tn5 integration site in chromatin and the associated cell barcode. | bgz |
| 3 | Cell by bin matrix: for each genome bin (non-overlapping window of some number of base pairs, e.g. 1000, 5000, 10000), whether reads from that cell were aligned to that bin | .csv |
| 4 | Cell by peak matrix: filtered version of cell by bin matrix, only including bins which are significantly represented in this dataset across all cellsn | .csv |
| 5 | Annotation files: cell by gene matrix, Motif analysis, dimensionality reduction, clustering, transcription factor enrichment for one cell vs. rest | .csv |
HuBMAP Metadata
The scATACseq metadata.tsv now resides in Github where it can be viewed and downloaded.
The bulkATACseq metadata.tsv now resides at this Github link.
- For questions about sciATACseq, contact: Dana L Jackson.
- For questions about bulk ATACseq, snATACseq or SNARE-ATACseq, contact: Blue Lake.
HuBMAP QA/QC of raw (state0) data files
The bolded steps below constitute a series of standard ATAC-seq data analysis workflow.
Pre-alignment QC:
The steps involved include:
| qc_metric | Threshold | Tool |
|---|---|---|
| (1)average_base_quality_scores | >20 (accuracy rate 99%) | Something like FastQC |
| (1) gc_content | - | Something like FastQC |
| sequence_length | >45 (encode) | Something like FastQC |
| (1) sequence_duplication | - | Someting like FastQC |
| (1) k-mer_overrepresentation | - | Something like FastQC |
| (2)contamination_of_primers_and_adapters_in_sequencing_data | - | Library specific data on adapters need to be provided to the read-trimming tool like trimmomatic (Bioinformatics. 2014 Aug 1; 30(15):2114-20.). |
(1) Computed by the HIVE. (2) TMCs will provide this information.
Definitions: Base quality scores: prediction of the probability of an error in base calling GC content: Percentage of bases that are either guanine (G) or cytosine (C ) K-mer overrepresentation: Overrepresented k-mer sequences in a sequencing library
Library-level Alignment QC
Note that this is not per-cell. After read trimming, FastQC can be run again to ensure the successful removal or this is iterated. The output are trimmed-reads. Trimmed reads are mapped to reference genome, using Bowtie2 (with soft-clip strategy).
| qc_metric | Threshold | Method |
|---|---|---|
| unique_mapping_percent | Ideally > 95% (Encode) Acceptable > 80% (at least for bulk) | SAMtools/Picard https://www.encodeproject.org/atac-seq/ |
| duplicate_reads_percent | - | SAMtools/Picard |
| median_fragment_length | >45 (Encode) | SAMtools/Picard |
| gc_bias | Biased if variance of GC content is larger than 95% of confidence threshold of the baseline variance | SAMtools/Picard |
| library_complexity | NRF>0.9, PBC1>0.9, and PBC2>3 | https://www.encodeproject.org/data-standards/terms/#library |
Uniquely mapping % – Percentage of reads that map to exactly one location within the reference genome. Duplicated reads % - Percentage of reads that map to the same genomic position and have the same unique molecular identifier (Encode)
Post-alignment processing QC (see Per cell QC metrics table below)
- Remove duplicated reads
- Remove low quality reads
- Remove mtDNA reads
- Remove black listed regions (now this is not very useful to do in scATAC-seq as opposed to bulk ATAC-seq); I doubt anyone should be doing this.
Once these “complicating” reads are removed. Tools like ATACseqQC/MultiQC (see refs in comment below) provide plots of fragment size distributions with decreasing and periodical peaks corresponding to nucleosome-free regions (NFR < 100bp) etc. There are other details like reads being shifted +4bp and -5bp for positive & negative strands etc. NFRs are interesting because fragments from there are enriched around transcription start sites (TSS) while NBR (nucleosome-bound regions)
Peak calling QC
Peaks are accessible regions. And this is a major step in ATAC-seq data analysis. Unclear whether we are planning to include this step in our standard pipeline If we are, then the one tool for this is HMMRATAC Nucleic Acids Res. 2019 Sep 19; 47(16):e91. Others are adaptations of Chip_seq, e.g., ENCODE uses MACS2 which is a count-based peak caller (basically is the read distribution different from a random background?). This is also where we can introduce biological replicates into the data analysis pipeline — again TMC expert’s should weigh in. Typically one can pool raw reads or combine peaks from individual samples or do more sophisticated statistical models like mixture models.
Final Step(s)
Interpretation (biological) of the peaks is the natural next step. These are typically done either at the peak or motif (specific sequence on the DNA that binds transcription factors) or nucleosome (typically longer fragments in ATAC-seq correspond to nucleosome fragments) or transcription factor footprint (in ATAC-seq footprint means a pattern where an active transcription factor bind to DNA and prevents Tn5 cleavage within the binding site) levels. Yet other things to be done would be e.g., integrating with RNA-seq data to eventually reconstrust regulatory networks (e.g.).
Files submitted by the TMC’s will be validated in the following ways:
- Checked for zero length files.
- The number of (raw) folders should be equal to …..
- The number of files should be equal to……..
If files submitted fail this criteria, the recommended action by the HIVE is to reject the dataset.
| Per cell QC metrics | Threshold Value/Range | Notes |
|---|---|---|
| nucleosome_signal | > 0.1 = ok >0.2, <10 = good | ratio nucleosome free to mononucleosomal fragments |
| blacklist_region_fragmentratio | <0.1 = ok <0.05 = good | https://github.com/Boyle-Lab/Blacklist |
| tss_enrichment_score | >2 = ok >6 = good | https://www.encodeproject.org/data-standards/terms/ |
| fraction_of_fragments_in_peaks | >0.3 = ok >0.5 = good | peaks called per cluster |
| total_unique_fragments | >1000 | Total number of unique fragments sequenced for the cell. Includes fragments that do not fall in peaks. |
| total_number_of_fragments_in_peaks | >500 | similar to scRNA-seq total UMI count. |
| mitochondrial_fragment_ratio | <0.1 = ok <0.05 = good | similar to total scRNA-seq mito gene UMI count |
| does_each_cell_have_corresponding_pass_qc_rna_data | True/False | SNARE-seq unique. If each cell have corresponding pass QC RNA data |
Terms defined in this document
Nucleosome signal
The ratio of fragments between 147 bp and 294 bp in length (mononucleosome) to fragments < 147 bp (nucleosome-free). This score quantifies the fragment length periodicity characteristic of an ATAC-seq experiment. Implementation: https://github.com/timoast/signac/blob/master/R/preprocessing.R#L587
Blacklist region fragment ratio
The ratio of fragment counts mapping to genomic blacklist regions to the total fragment count for the cell. Genomic blacklist regions are defined as regions in the genome that have anomalous, unstructured, or high signal in sequencing experiments independent of cell line or experiment. These regions are defined here: https://github.com/Boyle-Lab/Blacklist
Transcriptional start site (TSS) enrichment score
From ENCODE: The TSS enrichment calculation is a signal to noise calculation. The reads around a reference set of TSSs are collected to form an aggregate distribution of reads centered on the TSSs and extending to 1000 bp in either direction (for a total of 2000bp). This distribution is then normalized by taking the average read depth in the 100 bps at each of the end flanks of the distribution (for a total of 200bp of averaged data) and calculating a fold change at each position over that average read depth. This means that the flanks should start at 1, and if there is high read signal at transcription start sites (highly open regions of the genome) there should be an increase in signal up to a peak in the middle. We take the signal value at the center of the distribution after this normalization as our TSS enrichment metric
Note: ENCODE does not define what the “center of the distribution is”. We can define this as the middle 1000 bp (-500 to +500 centered at the TSS).
Single-cell ATAC R implementation
https://github.com/timoast/signac/blob/master/R/preprocessing.R#L882
Bulk ATAC python implementation
https://github.com/ENCODE-DCC/atac-seq-pipeline/blob/master/src/encode_task_tss_enrich.py
Example:

Fraction of fragments in peaks
The fraction of all fragments sequenced for a cell that intersects an annotated peak.
Total number of fragments
The total number of fragments for the cell that mapped to the genome.
Total number of fragments in peaks
The total number of fragments for the cell that fall in an annotated peak.
Mitochondrial fragment ratio
The ratio of fragments mapped to the mitochondrial genome to the total number of mapped fragments for the cell.
Software & Documentation
Cellranger-atac
Does mapping, some QC (for 10x Genomics scATAC-seq)
Signac package
Calculates QA/QC per-cell metrics, secondary analysis
- Documentation https://satijalab.org/signac/articles/pbmc_vignette.html
CRAN
- https://cran.r-project.org/web/packages/Signac/index.html](https://cran.r-project.org/web/packages/Signac/index.html)
Sinto package
Generate fragment file from BAM file
PyPI
- https://pypi.org/project/sinto/0.3.3/
- Documentation: https://timoast.github.io/sinto/basic_usage.html#create-scatac-seq-fragments-file
Snap
Does mapping, QA/QC, secondary analysis. Custom H5 file format.
- htts://github.com/r3fang/SnapATAC
- https://github.com/r3fang/SnapTools (generates inputs)
Do aggregated reads from all single cells closely recapitulate the open regions recognized by bulk ATAC-seq (how many cells do we need? 2000–50,000 cells)
Benchmark of batch effect measuring methods for scRNA-seq: https://genomebiology.biomedcentral.com/articles/10.1186/s13059-019-1850-9
| Metadata Element | Potential ValuesDefinition | Use case |
|---|---|---|
| Single-cell isolation | {FACS, microfluidics}, {FACS, microfluidics, nanowells}, {FACS}, {Droplet}, {Nanowells}, {None} None is for methods like sci-RNASeq | Batch effects |
| 2nd strand synthesis | TSO, {RNase H & DNA pol I}, {PolyA tailing and primer ligation} | - |
| Full-length cDNA synthesis? | {Yes}, {No} | - |
| Barcode addition | {Library PCR with barcoded primers}, {Barcoded RT primers}, {Barcoded TSOs}, {Barcoded RT primers and library PCR with barcoded primers}, {Ligation of barcoded RT primers} | - |
| Pooling before library | {No}, {Yes} | - |
| Library amplification | {PCR}, {In vitro transcription}, | - |
| Gene coverage | {Full-length}, {3’}, {5’}Dn | - |
TSO: template-switching oligonucleotide; FACS: fluorescence-activated cell sorting; PCR: polymerase chain reaction; DNA pol I: DNA polymerase I; cDNA: complimentary DNA; RT: reverse transcription; RNase H: ribuc
For Additional Help
Please contact Blue Lake